
Are you new to cryptocurrency trading and want to learn how to use moving averages to make smarter trades? Our dashboard tool lets you track EMA, SMA, and MA across multiple crypto pairs in real-time, helping you spot potential trading opportunities quickly.

What Are Moving Averages?
Moving averages are lines on a chart that show the average price over a specific period. They help traders see trends and potential reversals without getting lost in short-term price noise. Your tool supports three types:
-
EMA (Exponential Moving Average): Gives more weight to recent prices, reacting faster to market changes.
-
SMA (Simple Moving Average): Calculates the average price over the period equally, smoothing out price action.
-
MA (Moving Average): In your tool, MA is another name for SMA; it works the same way.
Tip: Beginners often start with EMA for fast signals or SMA/MA for a smoother trend view. Combining short-term and long-term moving averages can help detect potential trend changes early.
Check out the best 5m strategy for crypto.
Moving Average Crossovers: Golden Cross and Dead Cross
The easiest way for beginners to use moving averages is by watching for crossovers. This works for EMA, SMA, or MA:
Golden Cross (Buy Signal)
-
Occurs when a short-term moving average crosses above a long-term moving average.
-
Indicates upward momentum and potential buying opportunity.
-
Works for EMA, SMA, or MA depending on your preference.
Dead Cross (Sell Signal)
-
Occurs when a short-term moving average crosses below a long-term moving average.
-
Indicates downward momentum and potential selling or shorting opportunity.
-
Works for EMA, SMA, or MA.
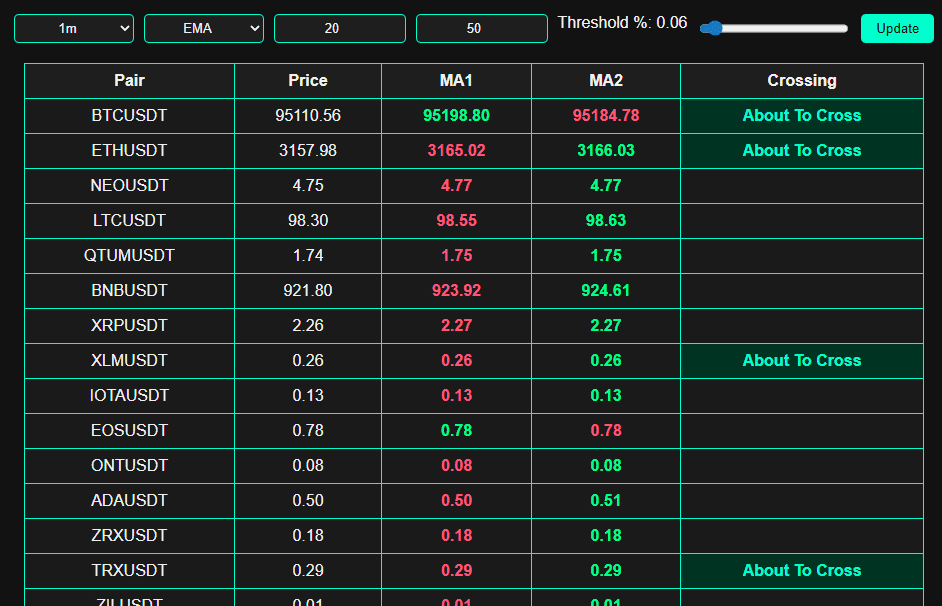
How to Use the EMA/SMA/MA Dashboard Tool
-
Select the Pair and Timeframe
-
Use the dropdown to choose the cryptocurrency pair you want to analyze (e.g., BTCUSDT).
-
Select your preferred timeframe (1m, 5m, 15m, 1h, 4h, 1d) to match your trading style.
-
-
Choose the Moving Average Type
-
Pick EMA, SMA, or MA depending on how fast or smooth you want your signals.
-
EMA reacts faster for short-term trades, while SMA/MA is better for long-term trends.
-
-
Set Periods
-
Enter the short-term period (e.g., 20) and the long-term period (e.g., 50).
-
Short-term averages track faster trends; long-term averages track the overall market trend.
-
-
Adjust the Threshold
-
Use the slider to set the “about-to-cross” threshold.
-
This helps you detect potential crossovers before they happen, giving you an early signal.
-
-
Click “Update”
-
The dashboard will load the latest prices and calculate the chosen moving averages for all selected pairs.
-
Pairs that are about to cross will be highlighted in the “Crossing” column.
-
-
Interpret the Signals
-
Golden Cross: Short-term MA crosses above long-term MA → potential buy opportunity.
-
Dead Cross: Short-term MA crosses below long-term MA → potential sell opportunity.
-
Use these signals in combination with other indicators or volume to confirm your trades.
-
-
Tips for Beginners
-
Refresh data no more than once every 10 seconds to avoid overloading the tool.
-
Focus on pairs that are closest to crossing for the most actionable signals.
-
Combine with trend and volume analysis for safer trading decisions.
-
How to Use Moving Averages in Your Trades
How to Use Moving Averages in Your Trades
If you want to use moving averages on fast charts, it really helps to understand how spreads, fees, and execution affect your results. Here’s a realistic 1 min scalping strategy that shows how to apply these ideas safely before risking real money.
1. Identify the Trend
Use a long-term moving average (like 200 periods) to see the main trend:
-
Price above the moving average → market is generally bullish.
-
Price below the moving average → market is generally bearish.
2. Spot Entry and Exit Points
Combine a short-term moving average (like 20 periods) with a long-term moving average (like 50 periods):
-
Buy when the short-term MA crosses above the long-term MA (Golden Cross).
-
Sell when the short-term MA crosses below the long-term MA (Dead Cross).
You can also explore our Doji Candle Detector to spot candlestick patterns that signal potential reversals.
Advanced Tips for Beginners
Check Multiple Timeframes
Look at moving averages on different timeframes (1m, 5m, 1h, 4h, daily). Confirming trends across multiple timeframes reduces false signals.
Watch Trading Volume
-
High trading volume during a crossover → stronger, more reliable signal.
-
Low volume → the signal may be weaker or a false breakout.
Pullback Strategy
-
Wait for the price to pull back to the moving average support instead of chasing the trend. Use the Hammer & Shooting Star Detector to identify support and resistance candles during pullbacks.
-
This reduces risk and increases the chances of entering at a better price.
For extra confirmation, try our RSI Over Bought/Sold Detector to check if the market is overextended before entering a trade.
Common Beginner Mistakes
-
Relying only on moving averages without confirming with other indicators.
-
Using very short-term averages in volatile markets → too many false signals.
-
Ignoring market context: moving averages work best in trending markets, not sideways markets.
Conclusion
Moving averages—EMA, SMA, and MA—are simple yet powerful tools for beginners to understand market trends and make smarter trades. By combining short-term and long-term averages, watching for golden and dead crosses, and confirming signals with other indicators, you can improve your trading decisions significantly.
Use our EMA/SMA/MA Dashboard to track multiple crypto pairs, spot potential crossovers early, and make trading easier and more organized.
Start practicing with moving averages today and level up your crypto trading skills!
8 thoughts on “How To Use EMA, SMA And MA In Crypto Trading”