
Candlestick Pattern Detector: Ultimate Guide for Traders
Trading is not just charts and gut feelings — it’s understanding price psychology. Candlestick patterns give traders visual cues about market sentiment and potential trend reversals. Among all formations, the Hammer and Shooting Star patterns stand out for their simplicity and reliability.
- Hammer: Signals bullish reversal after a downtrend.
- Shooting Star: Signals bearish reversal after an uptrend.
Manually spotting these patterns can be time-consuming, especially for crypto traders, day traders, and scalpers. This is where a
Candlestick Pattern Detector becomes essential — it automates detection, alerts you instantly, and reduces errors.
1. What is a Candlestick Pattern Detector?
A candlestick pattern detector is a software tool or script that automatically scans charts for predefined candlestick formations. It’s the trader’s secret weapon for spotting reversal opportunities in real time.
Key Features
- Automated Pattern Recognition: Detects hammer, shooting star, and other reversals instantly.
- Multi-Timeframe Analysis: Works on 1-minute, 5-minute, hourly, or daily charts.
- Custom Alerts: Notifications via platform, mobile, or email.
- Backtesting: Measure pattern accuracy on historical data.
Pro Tip: Combine candlestick detection with momentum indicators for higher accuracy. Try the
EMA Crossover Detector and the
RSI Overbought/Oversold Detector for confirmation.
2. Hammer Candlestick Pattern Explained
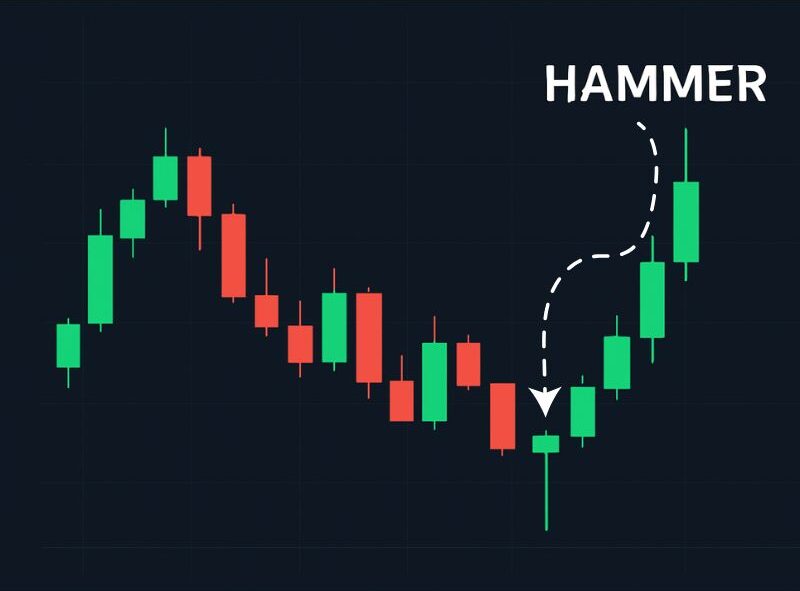
The Hammer is a bullish reversal pattern appearing at the bottom of a downtrend. It suggests buyers are stepping in and momentum may shift upward.
Characteristics of a Hammer
- Small body at the upper end.
- Long lower wick — at least twice the body.
- Little to no upper wick.
Using a Candlestick Detector for Hammers
-
- Automatically highlights hammer candles across timeframes.
- Alerts when hammers form near key support.
- Combine with sentiment tools like the
Long vs Short Ratio.
Example Trading Strategy
- Detector finds a hammer.
- Confirm reversal using RSI oversold levels.
- Enter long on the next candle.
- Stop-loss below the hammer’s wick.
3. Shooting Star Candlestick Pattern Explained
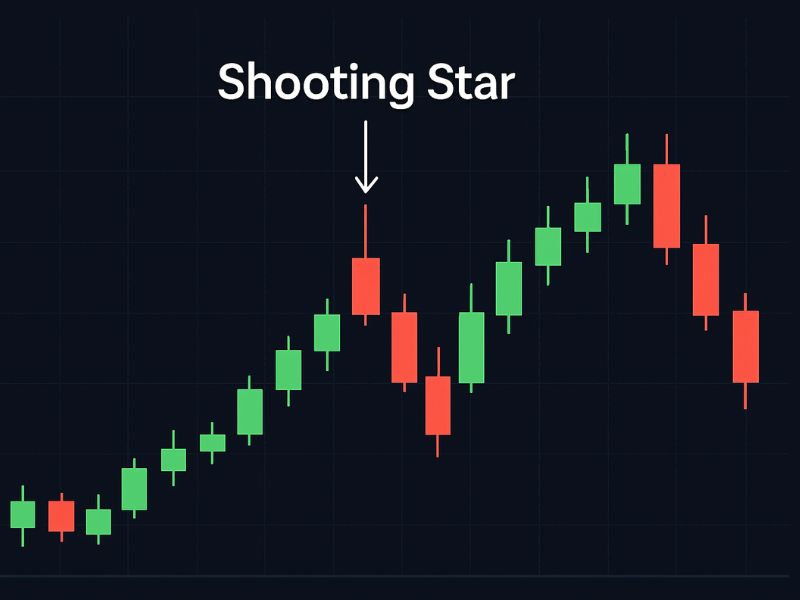
The Shooting Star signals a bearish reversal after an uptrend — showing buyers have lost strength and sellers may take over.
Characteristics of a Shooting Star
- Small body near the lower range.
- Long upper wick, at least twice the body.
- Little or no lower wick.
Using a Candlestick Detector for Shooting Stars
- Marks shooting stars automatically.
- Alerts when they appear near resistance zones.
- Combine with moving averages —
EMA Cross Detector.
Example Trading Strategy
- Detector identifies a shooting star in an uptrend.
- Confirm with RSI overbought.
- Enter short on next candle.
- Stop-loss above the pattern high.
Before we go deeper: if you’re still getting comfortable with the bigger picture of trading, these guides can help you build a stronger foundation:
- 1-Minute Scalping Strategy
- Beginner’s Guide to Crypto Scalping
- Crypto Risk Management Strategies
- Best Exchanges for Scalping
4. How a Candlestick Pattern Detector Improves Trading
Speed & Efficiency
- Scans hundreds of pairs automatically.
- Reduces human error.
- Use with
Market Opening Timer for timing volatility windows.
Accuracy & Consistency
- Eliminates subjective interpretation.
- Highlights patterns based on fixed rules.
Backtesting & Validation
- Test hammer & shooting star performance.
- Adjust detection thresholds to fit your strategy.
Risk Management Benefits
- Automatically identifies strong reversal zones.
- Helps position sizing around pattern strength.
5. Choosing the Best Candlestick Pattern Detector
Look for:
- Customizable thresholds (wick/body ratios).
- Multi-timeframe support from 1-min to daily.
- Smart alerts that trigger instantly.
- Platform compatibility with TradingView, MT4/MT5, or API connections.
- High reliability with minimal lag.
Pro Tip: Pair your detector with the
Doji Candle Detector to catch more reversal signals.
6. Common Mistakes Traders Make with Candlestick Patterns
- Ignoring the trend context.
- Using patterns alone without indicators.
- Overreacting to every alert.
- Skipping stop-losses.
- Trading patterns on the wrong timeframe.
7. Implementing Hammer & Shooting Star Detection in Your Trading
- Install your detector or use an online tool.
- Set alerts for hammer/shooting star formations.
- Combine with RSI, MACD, and EMA.
- Backtest the logic.
- Monitor charts using automated alerts.
8. Advanced Strategies Using Candlestick Pattern Detectors
1. Scalping on 1-Minute Charts
- Detect hammer formations in oversold zones.
2. Swing Trading
- Spot shooting stars near resistance on higher timeframes.
3. Crypto Day Trading
- Hammer and shooting star patterns perform well in volatile markets.
- Use with the
Doji Candle Detector for combined accuracy.
Conclusion: Maximize Your Profits with Candlestick Pattern Detectors
A candlestick pattern detector is more than software — it’s a game-changer. Whether you are scalping, day trading, or swing trading, automatic pattern detection helps you move faster, reduce errors, and trade with confidence.
Key Takeaways
- Hammer = bullish reversal, Shooting Star = bearish reversal.
- Detector automates pattern recognition.
- Combine patterns with EMA, RSI, and volume.
- Use
Hammer & Shooting Star Detector
to scan markets instantly.
Start using a candlestick pattern detector today — and make your trading decisions faster, smarter, and more accurate.