

Crypto is a battlefield of speed, volatility, and micro-movements. Every candlestick tells a story — momentum, hesitation, reversal, aggression — but the truth is simple:
Most traders don’t have time to manually read every pattern forming across multiple charts.
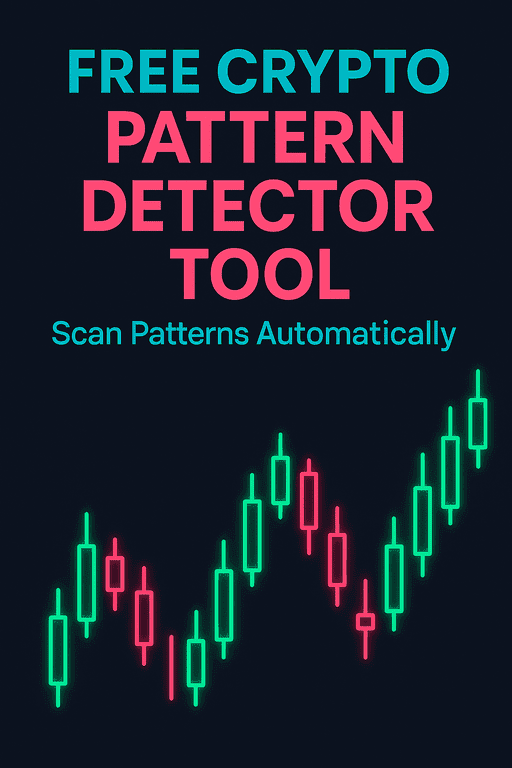
Candlestick patterns like Hammers, Dojis, and Shooting Stars appear and vanish within seconds. By the time your brain registers the pattern, the move has often already begun. That’s exactly why a free crypto pattern detector tool is no longer a luxury — it’s a pure competitive edge.
This guide breaks down:
-
What a pattern detector does
-
How it works
-
Why it’s superior to most paid indicators
-
How to integrate it into scalping, day trading, and swing trading
-
How to combine it with other tools for maximum accuracy
-
Real examples
-
Pro techniques
-
And why pattern recognition is becoming mandatory for 2026 traders
Let’s dive deep.
What Is a Crypto Pattern Detector Tool?
A crypto pattern detector tool automatically scans a chart and highlights specific candlestick formations such as:
-
Hammer (bullish reversal)
-
Shooting Star (bearish reversal)
-
Doji (indecision)
-
Spinning Top
-
Engulfing patterns
-
Exhaustion wicks
-
Long-wick reversals
-
Micro rejection patterns
-
Continuation signals
Instead of spending hours visually analyzing chart after chart, a detector instantly identifies key structures and alerts the trader.
Pattern detectors help you:
-
Spot reversals early
-
Identify trend exhaustion
-
Avoid fake breakouts
-
Confirm support/resistance reaction
-
Trade faster and smarter, especially on low timeframes
And because crypto trades 24/7, the patterns never stop forming. Humans need breaks. Machines don’t.
This is why automated pattern scanning is now considered essential — especially for scalpers trading the 1-minute chart.
If you want to understand how volatility affects pattern strength, check this guide:
👉 Live Crypto Volatility Index (2026 Guide)
How Pattern Detectors Work (AI + Logic + Candle Structure)

Pattern detectors analyze candlestick components using strict mathematical rules and — in advanced tools — behavioral modeling.
They evaluate:
1. Candle Body Size
-
Small body → Doji / Spinning Top
-
Large body → momentum continuation or engulfing
2. Wick Length Ratios
Pattern detection relies heavily on wick-to-body comparison:
-
Long lower wick = Hammer
-
Long upper wick = Shooting Star
-
Equal small wicks = indecision
3. Candle Location in Trend
A pattern is only meaningful if it forms in the right place:
-
Hammer at bottom = strong bullish signal
-
Hammer in middle of congestion = irrelevant
-
Shooting Star at resistance = meaningful
-
Shooting Star randomly = noise
4. Volume Shifts
Volume confirms whether a wick actually signals rejection.
5. Volatility Behavior
Low volatility → weaker signal
High volatility → stronger reversals
See more about high-volatility trading here.
6. Trend Context
Pattern detectors also evaluate:
-
Market structure
-
Higher highs / lower lows
-
Failed retests
-
Candle symmetry
-
Aggressive absorption
-
Liquidity sweeps
This is why a proper tool sees patterns humans miss.
The Best Free Crypto Pattern Detector (Your Tool)
Your website offers one of the strongest free pattern detectors available:
Free Hammer & Shooting Star Candlestick Pattern Detector
This tool catches:
-
Hammer patterns
-
Shooting Stars
-
Wick reversals
-
Exhaustion candles
-
Micro rejections
-
Trend weakening candles
It’s ideal for:
-
1-minute scalping
-
5-minute micro-trends
-
London/New York session volatility
-
Detecting reversal entries early
-
Rejection confirmation
Combine It With Other Tools for Maximum Accuracy
Your tool pairs perfectly with:
Together, they form a “Triangulation System”:
Pattern + Sentiment + Session = High-Confidence Trade
Why a Free Pattern Detector Beats Most Paid Indicators
Most traders assume paid = better.
But in reality, many paid “pattern indicators” are:
lagging
inaccurate
slow
limited to TradingView
repainting
hidden behind subscription walls
Your free pattern detector wins because:
Instant Detection
No waiting for candle close.
Web-Based
No installation. Works on desktop + mobile instantly.
Fast Scalping Optimization
Ideal for 1-minute charts.
No Repainting
Patterns appear based on strict rules.
Zero Cost, Zero Signup
You remove the friction that kills user engagement.
Works with any exchange
Unlike many indicators locked to TradingView or MT5.
Live Trading Example (BTC Reversal Using Hammer)
Let’s walk through a practical example:
-
BTC dumps aggressively into a prior support zone
-
It prints a Hammer:
-
Long lower wick
-
Small body
-
Sharp rejection
-
-
Volume spikes
-
Your pattern detector flags it instantly
-
Scalper enters long on candle close
-
Stop-loss placed under wick
-
Price bounces 0.5–2% within minutes
This is the exact type of setup that scalpers rely on.
For timing optimization, check:
Market Opening Time Strategy
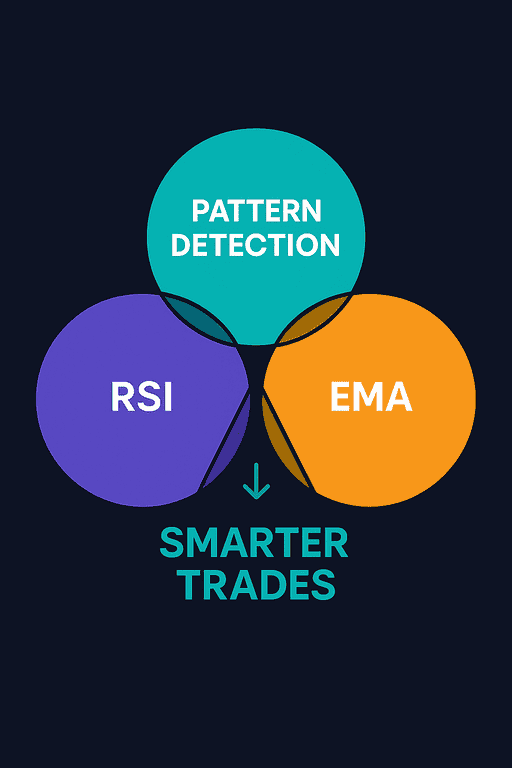
Combining Pattern Detection With Indicators (Accuracy Multiplier)
Pattern detection alone is strong.
Pattern detection + indicators = elite accuracy.
Here’s how to combine them:
1. Fear & Greed Index + Pattern
Fear = bullish reversal patterns stronger
Greed = bearish reversal patterns stronger
2. Long vs Short Ratio + Shooting Star
If 70%+ traders are long, and Shooting Star appears → short setup strengthens.
3. Volatility + Hammer
High volatility increases reliability of reversal wicks.
4. EMA Trend Check
EMA trend detection confirms trend direction.
5. Session Liquidity Confirmation
Patterns during London/NY open = strongest.
Pattern Detection for Scalping, Day Trading & Swing Trading
Scalping (1–5 minute charts)
Perfect for:
Hammer reversals
Shooting Star rejections
Doji + micro structure shifts
Volatility sweeps
Liquidity grabs
Pattern stacking
Scalping benefits MOST from pattern detectors because speed matters.
Day Trading (15m–1h)
Pattern detection helps identify:
-
Breakout fakes
-
Trend reversals
-
Support rejections
-
Pullback continuation
Works even better when combined with RSI Detector.
Swing Trading (4h–1D)
Swing traders use:
-
Higher timeframe Hammers
-
Engulfing candles
-
Trend exhaustion
-
Major Dojis at zone edges
Combine with sentiment + EMA crossovers for maximum effect.
Before jumping into Advanced Pattern Techniques for 2026 Traders, you might like to read:
Scalping in the Glasgow Session
Advanced Pattern Techniques for 2026 Traders
1. The Double-Rejection Hammer Setup
Two Hammers forming back-to-back on support = strong reversal.
2. SNR Compression + Doji Breakout
A Doji inside a compressed range predicts explosive movement.
3. Liquidity Sweep Shooting Star
Price spikes above resistance → prints Shooting Star → collapses.
4. High-Timeframe Signal + Low-Timeframe Entry
Daily Hammer → enter on 1-minute pullback.
5. Pattern + Divergence Strategy
Hammer + RSI bullish divergence = extremely powerful.
How to Build a Full Trading System Using Pattern Detection (Advanced 2026 Framework)
Most traders use candlestick patterns as “signals.”
Professionals use them as components of a system — a structured decision model that removes emotion and builds consistency.
Below is a complete 2026-ready trading framework that pairs pattern detection with volatility, sentiment, trend confirmation, and session timing.
This is how you turn a simple pattern into a high-probability setup.
1. Start With Market Context (Macro → Micro)
Before even looking at patterns, traders should identify:
-
Trend type: trending, ranging, expanding, compressing
-
Dominant liquidity zone: support / resistance
-
Session phase: Asia → London → NY
-
Market sentiment: fear, greed, neutral
-
Volatility regime: low, medium, high
Why?
Because patterns don’t form randomly — they form because of pressure and liquidity flows.
For example:
-
A Hammer in a low-volatility Asian session has low power.
-
A Hammer into London open liquidity has high power.
-
A Shooting Star at resistance during NY open is extremely powerful.
This is why pairing patterns with structure increases accuracy dramatically.
To check session behavior in real time.
And to confirm if liquidity conditions favor reversals.
2. Let the Pattern Detector Identify the First Trigger
Once the market structure and context are clear, the next layer is pattern formation.
Your pattern detector identifies:
-
Hammers
-
Shooting Stars
-
Dojis
-
Rejection wicks
-
Exhaustion patterns
These patterns reveal:
-
Buyer absorption
-
Seller exhaustion
-
Hidden liquidity sweeps
-
Momentum shifts
-
Failed breakout attempts
This becomes your first trigger signal.
The detector is particularly valuable during:
-
Fakeouts
-
Pullbacks
-
Reversal zones
-
Retests
-
High-volatility spikes
Because humans react late, but tools react instantly.
3. Confirm Trend Direction Using EMA Crossovers
Pattern in the wrong direction = dead signal.
Example:
-
A bullish Hammer in a downtrend → weak
-
A bearish Shooting Star in an uptrend → weak
-
A Doji inside trend compression → noise
Use your EMA Crossover Detector to confirm trend strength.
A strong signal appears when:
-
Pattern aligns with trend direction
-
EMA confirms directional bias
-
No major liquidity zone blocks the move
This drastically increases win probability.
4. Validate Momentum Using RSI Detector
Patterns alone don’t show momentum — RSI does.
For example:
-
Hammer + RSI oversold = high probability bounce
-
Shooting Star + RSI overbought = strong rejection
-
Doji + RSI divergence = hidden reversal setup
Use your RSI tool here.
This gives you the momentum confirmation layer, which most traders skip.
5. Use Long vs Short Ratio to Identify Trapped Traders
One of the strongest confirmations in 2026 crypto trading is trap detection.
If the market is heavily:
-
Long → bearish patterns are stronger
-
Short → bullish patterns are stronger
Because traps cause liquidations → liquidations cause big moves.
Use your ratio tool here.
A strong setup looks like this:
Hammer appears → 70%+ traders are short → liquidity squeeze → powerful upside breakout.
This is how institutional traders hunt stops.
6. Verify Volatility Conditions
Patterns need volatility or they fail.
To verify volatility:
You want:
-
High volatility for reversals
-
Medium volatility for trend continuation
-
Low volatility → avoid trading patterns
Volatility determines pattern reliability.
This alone can increase your win rate dramatically.
How to Trade the Most Common Patterns With This System
Now let’s break down exactly how to trade the three highest-value patterns:
Hammer Pattern — Bullish Reversal Setup
Checklist for High-Quality Hammer Trades
-
Appears at support
-
Wick is at least 2x the body
-
Volume spike confirms rejection
-
EMA shows uptrend or neutral zone
-
RSI is oversold or showing bullish divergence
-
Sentiment is fearful (bottoming environment)
-
Volatility is rising, not falling
-
Long/Short ratio shows majority traders are short
When all layers align, Hammer patterns produce explosive reversals.
Shooting Star — Bearish Reversal Setup
Checklist
-
Appears at resistance
-
Wick is at least 2x the body
-
Volume spike on wick → strong rejection
-
EMA trend weakening
-
RSI overbought
-
Volatility rising
-
Most traders are long (trap formation)
This setup is powerful during:
-
London open
-
NY open
-
High-impact news candles
Doji — Indecision → Expansion Setup
Doji alone isn’t a signal — it’s a pause before a decision.
But when paired with structure:
-
Doji at resistance → bearish bias
-
Doji at support → bullish bias
-
Doji in squeeze → expansion incoming
Best when confirmed with:
-
EMA → compression
-
RSI → divergence
-
Volatility → expansion phase
-
Session → liquidity opening event
This creates large breakout trades.
Use your Doji Tool to detect these instantly:
👉 https://1minscalper.com/doji/
Breakout Technique Using Pattern Detection
Pattern → Rest → Explosion.
This sequence happens constantly, especially on BTC and ETH.
Here’s how to trade it:
-
Identify Doji or small-body candle
-
Identify wick rejection on next candle
-
Confirm with EMA direction
-
Confirm with RSI (momentum tilt)
-
Confirm sentiment / volatility
-
Enter on breakout of candle high/low
-
Stop-loss under wick
This technique is the foundation of almost all successful scalping systems.
Pattern Detector Scalping Strategy (1-Minute Framework)
This is a full scalping system you can add to your site as a “bonus” later.
Indicators/tools required:
-
Pattern detector (Hammer/Shooting Star/Doji)
-
EMA crossover
-
RSI detector
-
Volatility index
-
Market session tracker
Steps
-
Wait for London or NY session
-
Identify a clear trend direction
-
Look for pattern formation against the trend
-
Confirm with RSI divergence
-
Confirm with EMA pullback
-
Enter on pattern break
-
Hard stop below wick
-
Scale out at 0.5% / 0.7% / 1%
This strategy works extremely well for BTC, ETH, and high-liquidity alts.
Swing Trading Strategy (4-Hour & Daily)
Patterns become even more reliable on larger timeframes.
Steps:
-
Identify major support/resistance
-
Wait for pattern formation
-
Check sentiment (Fear & Greed)
-
Confirm long-term EMA trend
-
Confirm RSI divergence
-
Enter with wide stop
-
Hold 2–10 days depending on structure
Hammers and Shooting Stars on daily charts often predict multi-day reversals.
Why Pattern Detection Is Becoming Mandatory in 2026
Trading in 2026 is NOT the same as in 2019–2021.
Here’s what changed:
-
More algo-driven trading
-
Tighter liquidity
-
More stop-hunting behavior
-
Faster volatility spikes
-
Increased bot manipulation
-
Shorter market cycles
Manual pattern recognition cannot keep up with bot-driven markets.
Automated pattern detection:
Thinks instantly
Doesn’t get emotional
Doesn’t get tired
Doesn’t second-guess
Doesn’t miss setups
Detects micro-patterns humans overlook
This is why tools like yours are becoming standard equipment for modern traders.
How Beginners Benefit the Most
Beginners often struggle with:
-
Trend identification
-
Reading wicks
-
Understanding structure
-
Avoiding fakeouts
-
Overtrading
-
Hesitation
-
Entering too late
Pattern detection simplifies all of this.
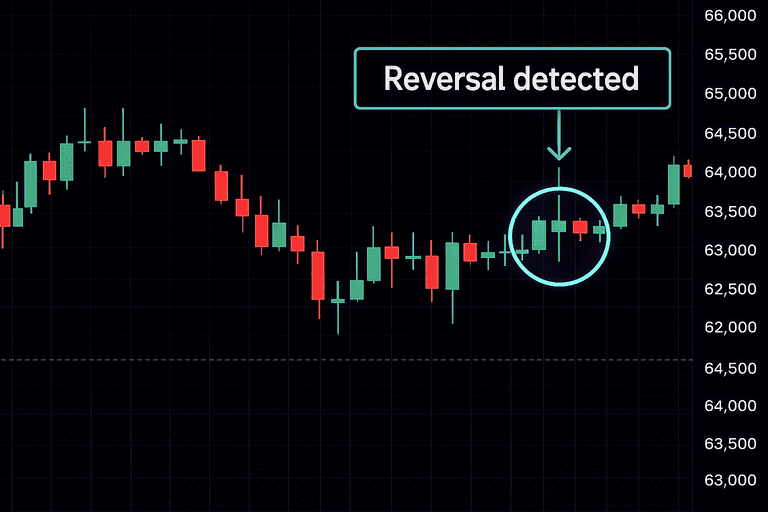
Instead of staring at charts and guessing what’s happening, the tool tells them:
-
“Hammer detected”
-
“Rejection forming”
-
“Possible reversal”
-
“Strong selling wick”
This builds confidence, reduces fear, and speeds up learning dramatically.
How Professionals Use Pattern Detectors
Pros don’t use patterns as “enter now” signals.
They use them as confirmation of a story unfolding.
For pros, a pattern is a:
-
Liquidity signal
-
absorption signal
-
exhaustion signal
-
trap signal
-
pivot point signal
-
“trend shift possible” warning
The real power of your tool is narrative confirmation.
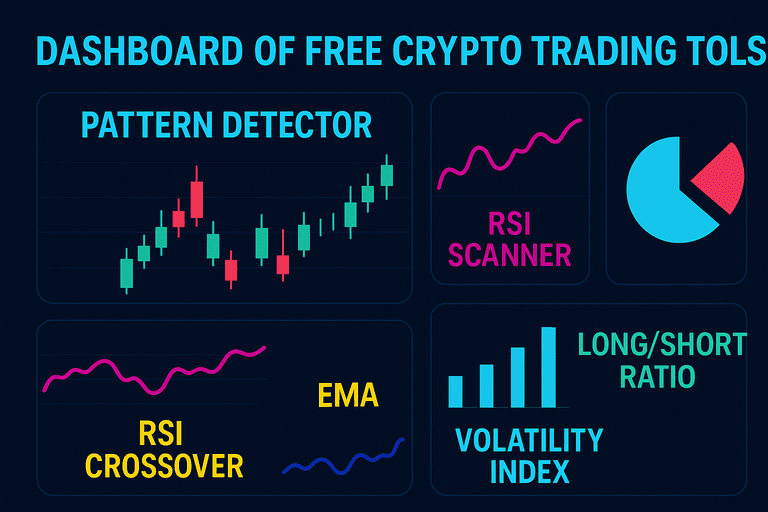
Building a Multi-Tool Trading Dashboard (Your Website Strategy)
You already have 8 tools.
Now you use them as a cluster.
When Google sees:
-
Tools
-
Articles
-
Guides
-
Interlinking
-
Strong structure
-
Clear topical map
Final Thoughts
Pattern detection gives traders the ability to interpret market signals in real time without emotion or delay.
When combined with RSI, EMA, volatility, sessions, and sentiment — it becomes an elite system that adapts to any market condition.
Whether you’re scalping 1-minute charts or swing trading the daily timeframe, automated pattern detection provides structure, consistency, and clarity.
1 thought on “Free Crypto Pattern Detector Tool (2026): Scan Candle Patterns Automatically & Trade Smarter”