

Candlestick patterns reveal market psychology and help traders anticipate potential reversals. Among the most reliable signals are the Hammer and Shooting Star. When understood correctly, these patterns give traders a high-probability edge, especially in volatile crypto markets.
This guide will teach you how to identify Hammer and Shooting Star patterns, understand their psychology, and trade them with confidence.
What Is a Hammer Candlestick?
The Hammer candlestick pattern signals a bullish reversal after a downtrend. Sellers push the price downward, but buyers reclaim control—showing strength and potential trend reversal.
You might also like to read Beginner’s Guide to Crypto Scalping And Crypto Breakout Alerts.
Key Features of a Hammer:
- Small real body near the top of the candle.
- Long lower shadow (at least 2× body size).
- Little to no upper shadow.
- Appears at the bottom of a downtrend.
Why Hammers Work:
The long lower wick shows aggressive selling pressure that is ultimately absorbed by buyers. This shift in momentum hints that a bullish reversal may follow.
What Is a Shooting Star Candlestick?
The Shooting Star is the bearish counterpart—signaling exhaustion after an uptrend. Buyers push the price up, but sellers smash it back down, showing weakening bullish momentum.
Key Features of a Shooting Star:
- Small real body near the bottom.
- Long upper wick (2× body size).
- Minimal or no lower shadow.
- Forms after an uptrend or rally.
Why Shooting Stars Work:
The long upper wick signals buyer exhaustion when sellers overpower the move. This warns that a bearish reversal may follow.
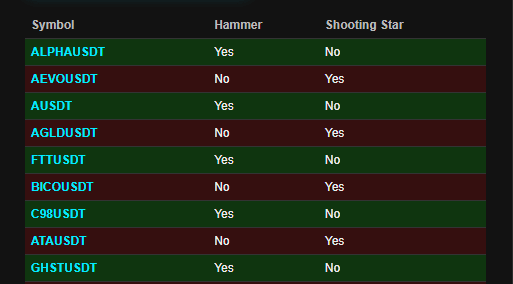
How the Hammer & Shooting Star Detector Helps
Instead of manually scanning charts, the Hammer & Shooting Star Detector automatically finds pairs forming these patterns. It analyzes multiple timeframes and sorts results based on accuracy.
Benefits:
- Scan markets automatically across many pairs.
- Reduce emotional trading.
- Catch reversal setups early.
- Improve accuracy with real-time alerts.
How to Trade Hammer & Shooting Star Patterns
1. Identify the Trend
- Hammer: Look for downtrends nearing support areas.
- Shooting Star: Look for uptrends reaching resistance levels.
2. Wait for Confirmation
- Hammer: Enter long when the next candle closes above the Hammer’s high.
- Shooting Star: Enter short when the next candle closes below the Shooting Star’s low.
- Confirm with tools like the RSI Overbought/Oversold Detector, MACD, or volume.
3. Define Entry & Exit Points
- Entry:
- Hammer → Buy after bullish confirmation.
- Shooting Star → Sell after bearish confirmation.
- Stop Loss: Place SL below hammer low or above shooting star high.
- Take Profit: Aim for nearby support/resistance or use 1:2–1:3 RR.
4. Avoid Common Mistakes
- Don’t trade the pattern alone. Use confirmation.
- Avoid low-volume markets with weak follow-through.
- Consider broader trend and market context.
Advanced Trading Tips
Scalping Strategy
- Look for Hammers on oversold dips using the RSI Detector.
Swing Trading
- Use Shooting Stars at major resistance levels with the EMA Crossover Detector for trend confirmation.
Crypto Day Trading
- Combine candlestick patterns with the Long vs Short Ratio Tool for sentiment alignment.
- Use Doji confirmations with the Doji Detector.
Pattern Clusters
- Combine Hammer/Shooting Star detection with other patterns (Doji, engulfing, morning/evening star) for stronger signals.
Conclusion
Mastering the Hammer and Shooting Star patterns gives traders a powerful edge in spotting reversals early. When combined with confirmation tools, proper entries, and disciplined risk management, these patterns become high-probability setups across all markets.
Use the Hammer & Shooting Star Detector to automate detection, improve accuracy, and never miss a key reversal.
2 thoughts on “How to Trade Hammer & Shooting Star Candlestick Patterns: A Professional Guide”