
Most crypto traders don’t lose money because indicators are “bad”.
They lose money because they use too many indicators, on the wrong timeframe, with no execution plan.
This 2026 guide breaks down the best cryptocurrency trading indicators, when to use them, and which combinations actually work — especially for active traders and 1-minute scalpers.
No fluff. No chart clutter. Just indicators that make sense in modern, high-volatility crypto markets.
Quick Answer: Best Indicators by Trading Style (2026)
If you want a fast answer, start here:
-
Scalping (1–5 min): RSI + VWAP + EMA
-
Intraday / Day Trading: EMA + MACD + Volume
-
Trend Trading: Moving Averages + ADX
-
Range / Chop Markets: RSI + Bollinger Bands
The key is matching indicators to market conditions, not stacking them blindly.
All Tools and instructions are here.
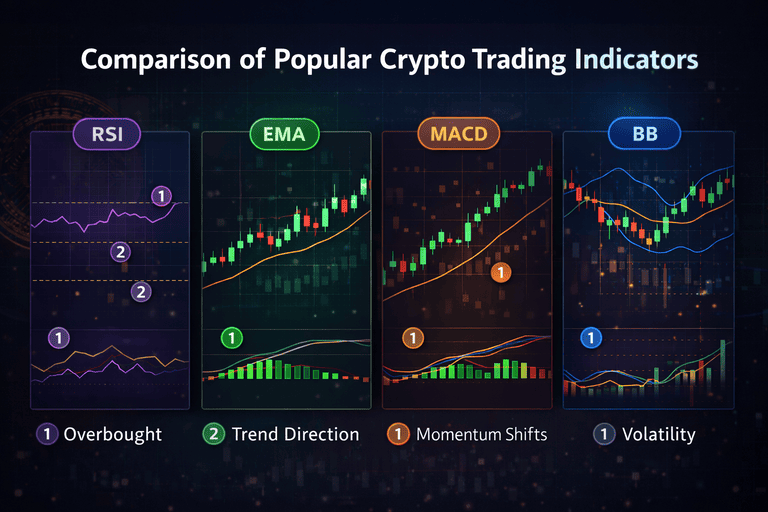
Indicator Comparison Table (Fast Overview)
| Indicator | Best Use Case | Timeframe | Common Mistake |
|---|---|---|---|
| RSI | Overbought / Oversold | Short | Using default settings only |
| EMA | Trend direction | All | Too many EMAs |
| MACD | Momentum shifts | Mid | Entering too late |
| VWAP | Scalping & execution | Intraday | Ignoring session resets |
| Bollinger Bands | Volatility | Short–Mid | Trading every touch |
| ADX | Trend strength | Mid–Long | Using in sideways markets |
1. Moving Averages (SMA & EMA)
Moving Averages smooth price action and help identify trend direction.
-
SMA (Simple MA): Better for higher timeframes and broader trends
-
EMA (Exponential MA): Reacts faster — preferred by scalpers and day traders
A common setup is combining a fast EMA with a slow EMA to spot trend shifts and momentum changes.
If you trade actively, EMA crossovers are far more useful than slow SMAs.
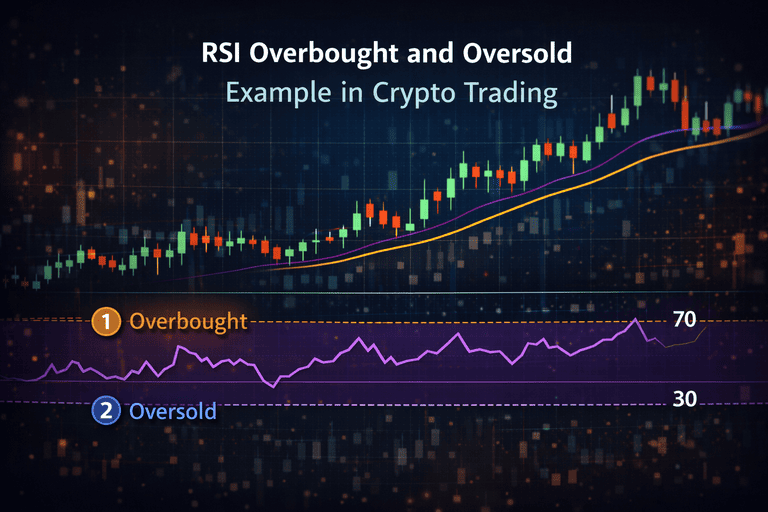
2. RSI (Relative Strength Index)
RSI measures momentum and helps identify overbought and oversold conditions.
-
RSI above ~70 → potential exhaustion
-
RSI below ~30 → potential rebound
In modern crypto markets, many traders adjust RSI settings (e.g. 7–10 periods) for faster reaction on short timeframes.
RSI works best when combined with trend context, not alone.
You can test real-time conditions using the RSI Overbought/Oversold Scanner on 1MinScalper.
3. MACD (Momentum & Trend Confirmation)
MACD tracks the relationship between two moving averages and helps spot momentum shifts.
Best used for:
-
Trend continuation
-
Momentum confirmation
-
Filtering false entries
MACD is slower than RSI, which makes it better as a confirmation tool, not a trigger.
For most patterns you can read Crypto Pattern Detector Tool (2026). Its free on our tools data base.
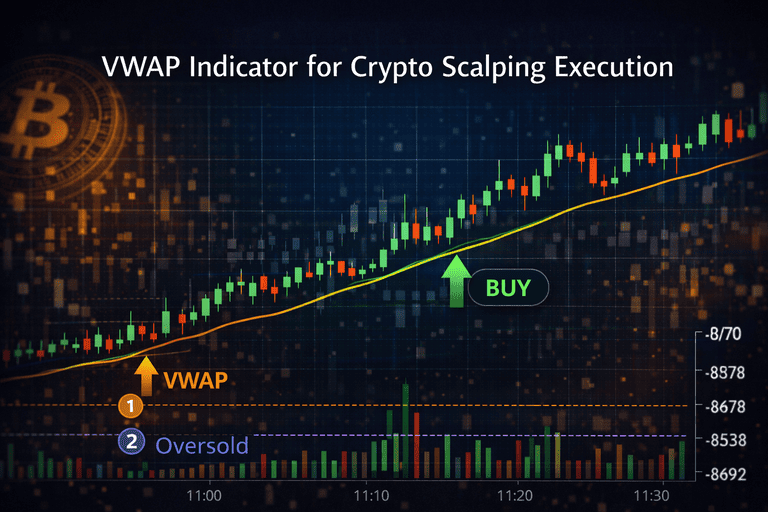
4. VWAP (Volume-Weighted Average Price)
VWAP is essential for scalpers and intraday traders.
It shows the average price weighted by volume and acts as a fair value zone during the session.
-
Price above VWAP → bullish bias
-
Price below VWAP → bearish bias
In 2026-style scalping, VWAP is more useful than many classic indicators because it reflects real execution behavior, not just price.
5. Bollinger Bands (Volatility)
Bollinger Bands expand and contract with volatility.
-
Tight bands → volatility compression (possible breakout)
-
Wide bands → high volatility (risk of mean reversion)
They work best in range-bound or transitioning markets, not strong trends.
6. ADX (Trend Strength)
ADX does not tell direction — it tells whether a trend is strong.
-
ADX above ~25 → strong trend
-
ADX below ~20 → sideways or weak market
This helps you decide which indicators to trust:
-
Strong trend → trend-following tools
-
Weak trend → oscillators like RSI
Best Indicator Combinations (What Actually Works)
Avoid stacking indicators that measure the same thing.
A simple, effective structure:
-
Trend: EMA or Moving Average
-
Momentum: RSI or MACD
-
Confirmation / Execution: Volume or VWAP
This gives you a three-layer decision system instead of indicator noise.
If you even dont want to look the chart at all, then learn How to Trade Crypto Without Watching Charts All Day.
Common Indicator Mistakes (Very Expensive)
-
Using too many indicators
-
Mixing timeframes randomly
-
Ignoring volatility
-
Trusting indicators without execution context
Indicators confirm decisions — they don’t replace thinking.
Indicators vs Strategy (Critical Point)
Indicators should support your strategy, not define it.
Before choosing indicators, you should already know:
-
Your timeframe
-
Your risk tolerance
-
Your execution style
If you’re trading short-term, indicator speed and fees matter more than perfect signals.
This is explained in detail in the Ultimate 1-Minute Scalping Strategy on 1MinScalper, which focuses on execution-first trading rather than indicator overload.
Test Indicators With Real-Time Crypto Tools
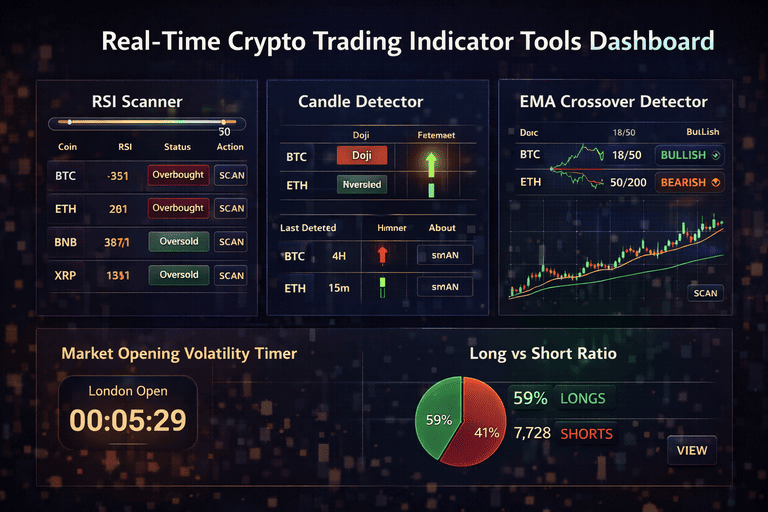
If you want to apply indicators faster and more accurately, you can use these free tools on 1MinScalper:
These tools help confirm setups in real time, which matters far more than theoretical indicator settings.
Final Thoughts (2026 Perspective)
There is no “best” indicator for everyone.
The best traders in 2026:
-
Use fewer indicators
-
Match tools to market conditions
-
Focus on execution, not prediction
Indicators don’t predict the future — they help you react better when the market moves.
Use them wisely, test constantly, and let simplicity work in your favor.
1 thought on “Best Trading Indicators for Crypto (2026 Guide)”